
Home prices increase in August
The S&P/Case-Shiller non-seasonally adjusted Composite-10 price index increased 0.87 percent since August.
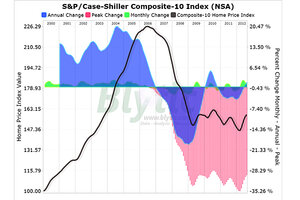
This graph tracks the S&P/Case-Shiller Composite-10 Index since 2000. The Composite-10 home prices index increased 1.35 percent in August 2012 compared to August 2011.
SoldAtTheTop
The latest release of the S&P/Case-Shiller (CSI) home price indices for August reported that the non-seasonally adjusted Composite-10 price index increased 0.87% since August while the Composite-20 index increased 0.88% over the same period.
The latest CSI data clearly indicates that the price trends continued to experience a lift through the typically more active spring-summer season and as I recently pointed out, the more timely and less distorted Radar Logic RPX data while continuing to capture rising prices, is starting to see a leveling off of the trend as the data moves through the summer transactions and heads for the typical declines seen in late-summer and fall.
The 10-city composite index increased 1.35% as compared to August 2011 while the 20-city composite increased 2.03% over the same period.

Both of the broad composite indices show significant peak declines slumping -29.90% for the 10-city national index and -29.37% for the 20-city national index on a peak comparison basis.
To better visualize today’s results use Blytic.com to view the full release.